If you don’t own dedicated Gantt chart software you can create simple Gantt charts in Excel by creating a customised stacked bar chart. This tutorial applies to Excel 2010, but the same thing can be achieved in other versions of Excel. Please watch our video and/or follow our step by step instructions. You can also download the featured file. Please see our Excel Dashboard training course if you would like this training delivered at your place of work. Please see our Excel Dashboard training course if you would like this training delivered at your place of work.
Enter Your Gantt Chart Data
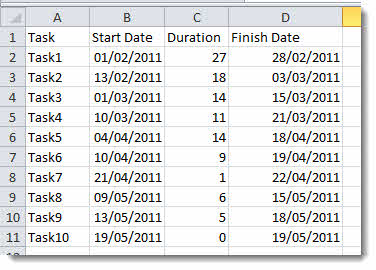
Start off by creating a table of tasks as shown below.
Create a Stacked Bar Chart
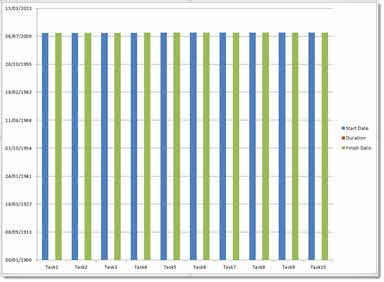
Click anywhere in the data and press the F11 key on your keyboard to create a chart on a separate sheet. – which should look like the chart below.
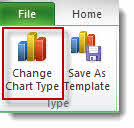
Click on the Change Chart Type button on the Ribbon
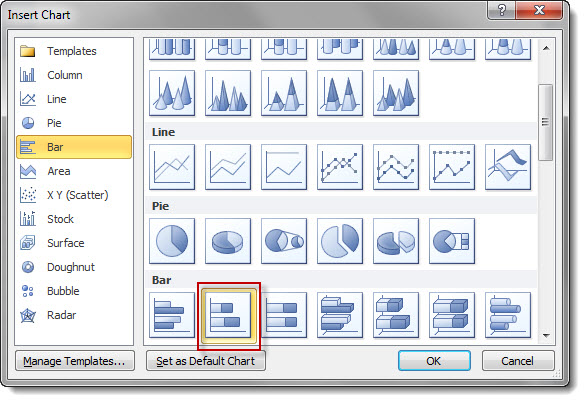
and select the stacked bar chart as your chart type and click OK to confirm.
Your chart should now look like this…
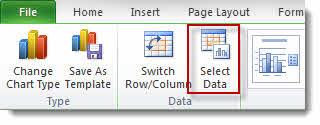
Now, click the Select Data button on the Ribbon
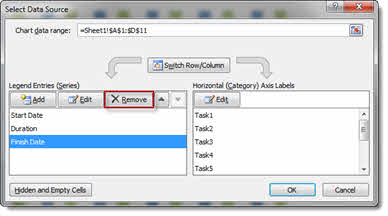
We want to remove the Finish Date series, so select it in the left hand list and then click the Remove button. Click OK to confirm.
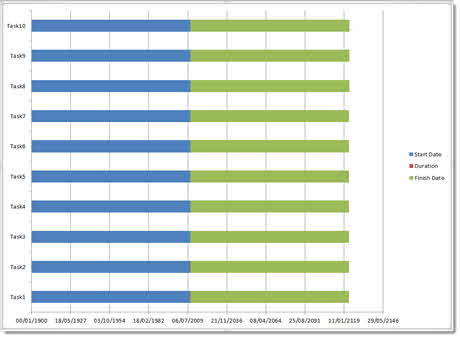
Your chart should now look like this…

Format the Chart to Look Like a Gantt Chart
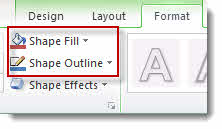
We are now going to hide the Start Date series. To do this click on any blue bar – this will select all blue bars on your chart. Now click on the Format tab on the Ribbon and use the Shape Fill menu to set the fill to No Fill and use the Shape Outline menu to set the outline to No Outline.
Your chart should now look like this…
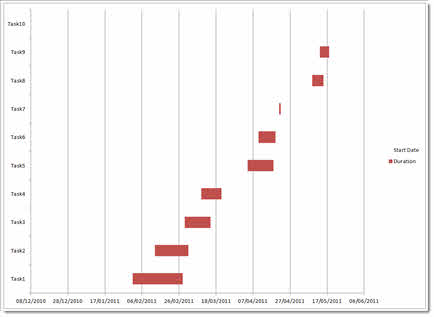
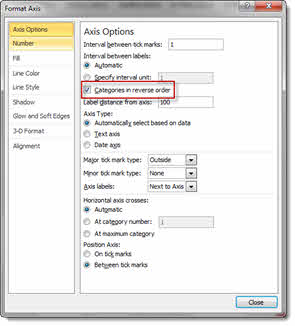
To change the order of the tasks so Task 1 appears at the top of the chart, double-click on the vertical axis labels. In the Format Axis dialogue box tick the Categories in reverse order option. Click on Close to confirm.
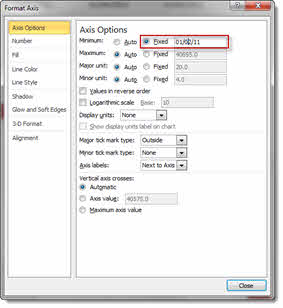
To change the start date on your horizontal axis, double-click the horizontal axis labels. Click the Fixed radio button for the minimum value option and then add your start date to the box as shown below. Click Close to confirm.
You might want to change other formatting options in your chart and move the chart to the same page as your data – but this is pretty much all you need to know to create a Gantt chart.