Waterfall Charts
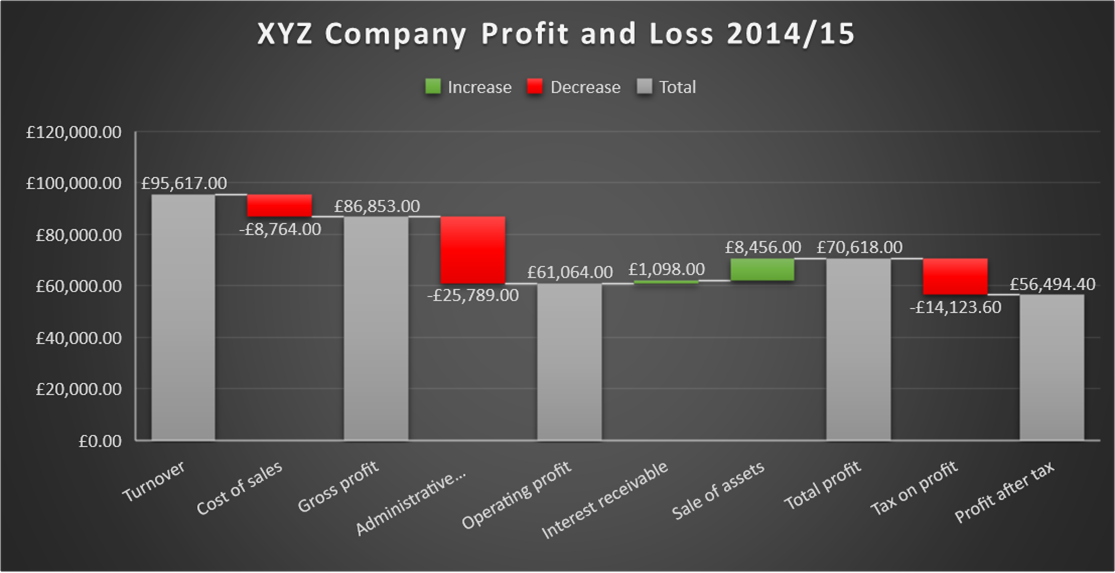
Watch our video tutorial above to see how to create a Waterfall chart in Excel 2016. Please see our Excel Dashboard training course if you would like this training delivered at your place of work. A Waterfall chart is useful when you want to display a series of totals and how they are affected by intermediary positive and negative values. This is useful for data that has inflows and outflows, for example:
- financial data in the form of a profit or loss sheet;
- population growth
- customer growth/retention