To group data in a PivotTable by a numeric field use LabelRange.Group. LabelRange is a property of the PivotField object. Group is a method with the following parameters.
LabelRange .Group(Start, End, By, Periods)
For a numeric field, use Start, End and By as described in the table below
| Name | Required/Optional | Data Type | Description |
|---|---|---|---|
| Start | Optional | Variant | If omitted or True , the first value in the field is used. |
| End | Optional | Variant | If omitted or True , the last value in the field is used. |
| By | Optional | Variant | If field is numeric , this argument specifies the size of each group. If the field is a date, use to group by x days. |
| Periods | Optional | Variant | Not relevant to numeric fields |
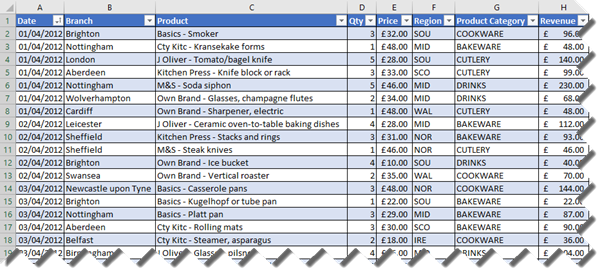
The code below relates to the data shown above.
Dim ws As Worksheet
Set ws = ActiveSheet
Dim wb As Workbook
Set wb = ActiveWorkbook
Dim PTcache As PivotCache
Dim PT As PivotTable
Dim SLcache As SlicerCache
Dim SL As Slicer
Dim pf As PivotField
'Define the cache for the PivotTable
Set PTcache = wb.PivotCaches.Create(SourceType:=xlDatabase, _
SourceData:=Range("Sales_Data[#All]"),Version:=xlPivotTableVersion15)
'Create the PivotTable
Set PT = ws.PivotTables.Add(PivotCache:=PTcache, _
TableDestination:=Range("J1"), TableName:="SalesAnalysis")
PT.AddFields RowFields:="Price"
PT.AddDataField Field:=PT.PivotFields("Revenue"), _
Caption:="No of Transactions", Function:=xlCount
'Group Date Field by Month and Year
PT.RowAxisLayout xlTabularRow
Set pf = PT.PivotFields("Price")
pf.LabelRange.Group Start:=0, End:=50, By:=10
pf.Caption = "Price Range"
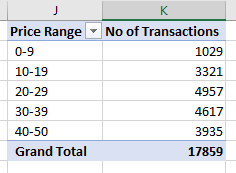
The code above would create the PivotTable shown below.