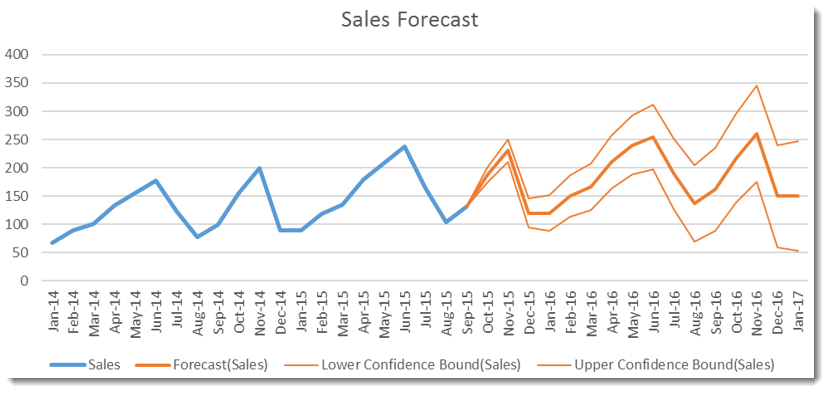
The forecast sheet is good at forecasting based on historical time-based data. You might use this for example to predict the next 12 months’ sales based on the previous years’ data. The forecast sheet creates a chart and table displaying forecasted values. This feature is new in Excel 2016. Watch our video to see a demonstration and download the featured file here.
Notes on your timeline data:
• Your timeline data must express consistent intervals. So you can’t mix a one-month interval with a one-week interval or one-year interval.
• Your timeline data can have up to 30% of its data points missing.
• You can have more than one value with the same timeline stamp.
See Microsoft’s page on Forecast Sheets