A Radar chart or Spider chart plots values from the center of the chart outwards. In the example below the Radar chart plots average scores for a course evaluation questionnaire. The video below explains how to create this chart. Please see our Excel Dashboard training course if you would like this training delivered at your place of work.

The shape of the filled Radar chart indicates, in this example, that the course tutor has scored relatively well but the course design and content could be improved: the chart has been designed so that questions relating to the performance of the tutor are on the right side and the questions relating to the course design are on the left.
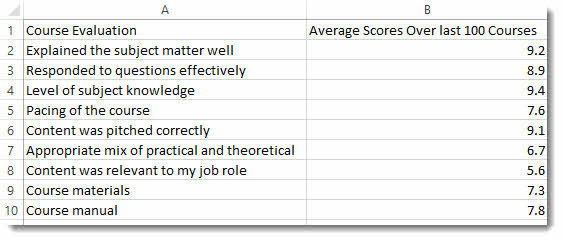
Here’s the data used in the Radar chart.
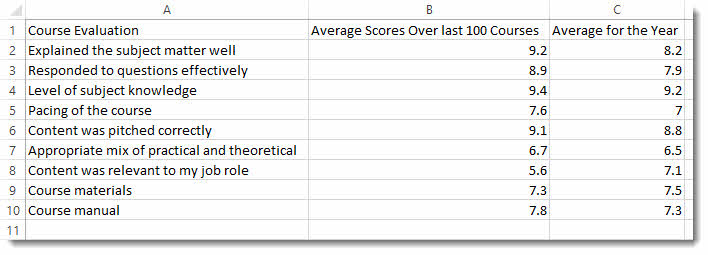
Say I wanted to compare these scores with the averages for the current year: this would give me an indication of where there has been an improvement or worsening in scores. Here’s the data:
And here’s what the Radar chart looks like: I can see pretty easily where the rating have improved or worsened.
